FinTech
FinData
Equity Data Terminal: Designing a Unified Research Experience for Real-Time Financial Analysts
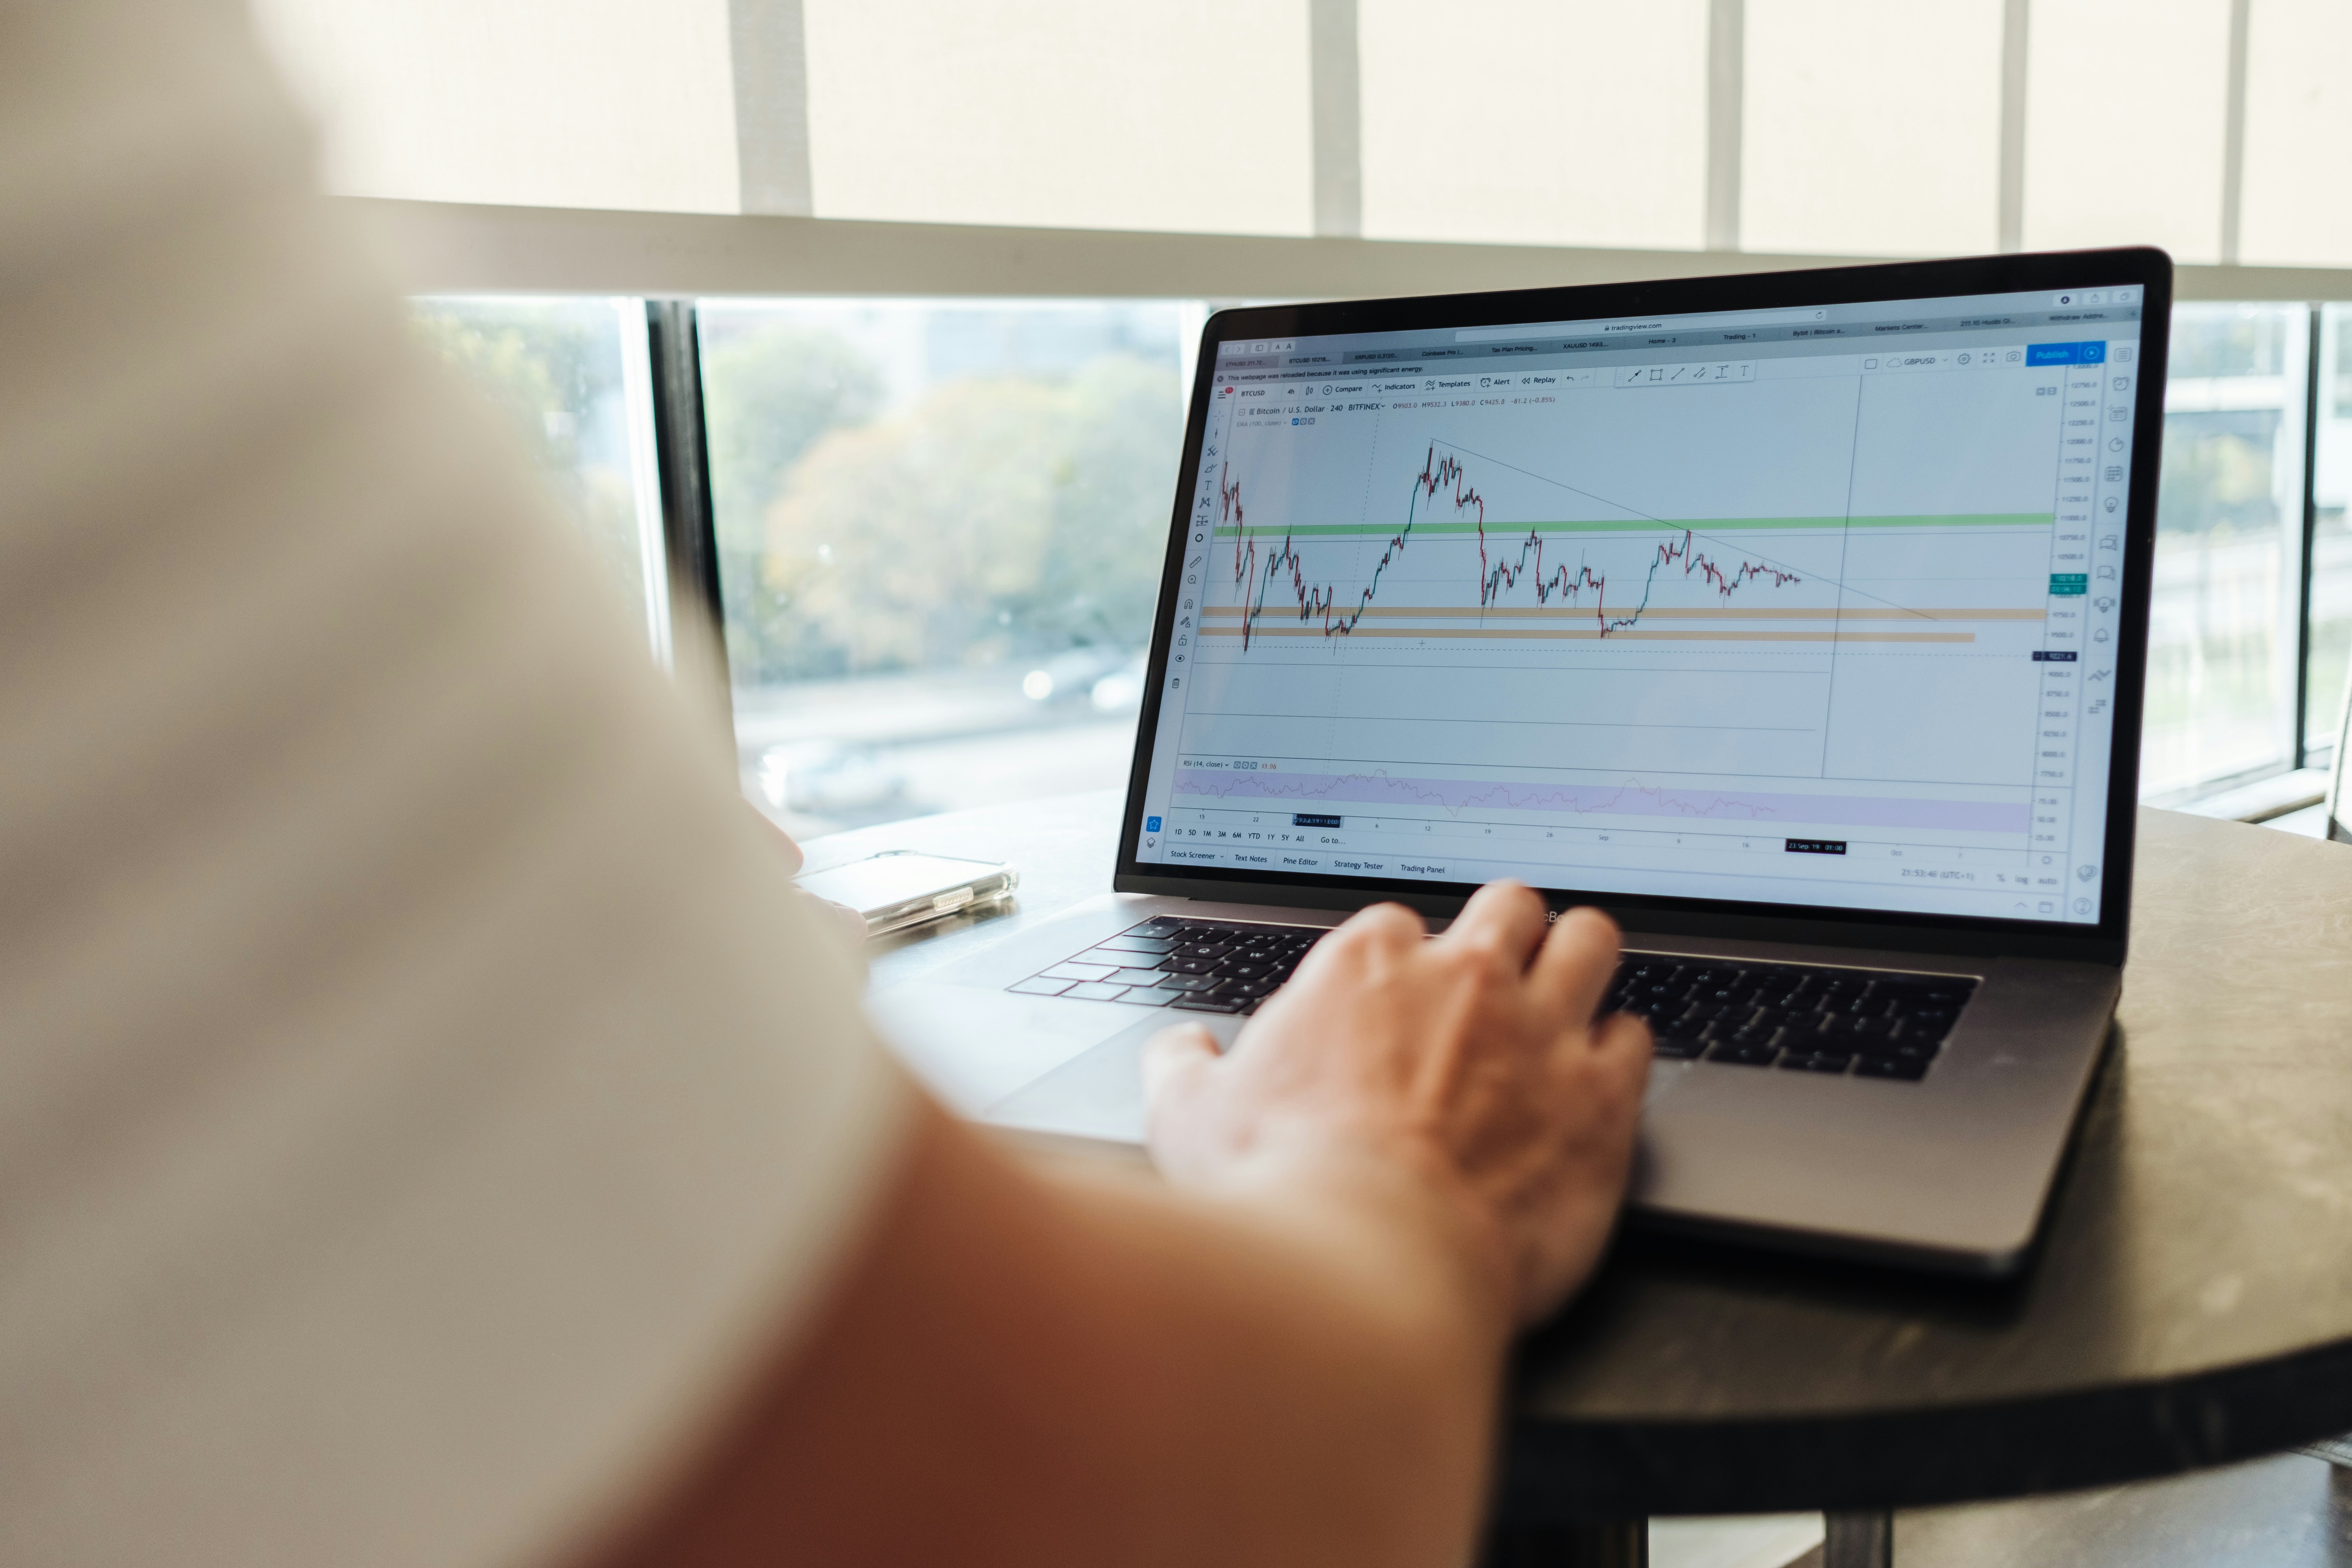
Investors struggled with fragmented financial data, hindering performance tracking and investment decisions. We designed EDT to address this by providing an all-in-one, real-time platform that offered comprehensive insights on stock performance, earnings, profitability, and market trends.


Overview
Led the design of the Equity Data Terminal (EDT), a centralized hub within AlphaSense, enabling financial analysts to efficiently access and analyze equity research data.
Role
Sole Product Designer, responsible for end-to-end UX/UI design.
Team
Collaborated with UX Researcher, Product Managers, Engineers, and Data Scientists.
Timeline
6-8 months.
About
AlphaSense is an AI-powered market intelligence platform that helps professionals make smarter business decisions by delivering insights from an extensive universe of public and private content, including company filings, event transcripts, news, trade journals, and equity research.
Business Goals
Enhance the platform's value proposition by providing a dedicated space for equity research, thereby increasing user engagement and retention among financial analysts.
Product
Goals
Develop a user-centric interface that consolidates various equity research tools and data sources, streamlining the research process for analysts.

Target Users
Buy-side Analysts
Require comprehensive data to make investment decisions.
Sell-side Analysts
Need to monitor market trends and company performance.
Portfolio Managers
Seek aggregated insights for portfolio strategy.
User Problems
Navigating between multiple tools to gather necessary data.
Time-consuming processes to compile and analyze information.
Difficulty in customizing dashboards to individual research needs.
Design Approach & Process
Design Goals
Create a centralized terminal integrating various equity research functionalities.
Ensure intuitive navigation and data visualization.
Allow customization to cater to individual analyst workflows.
What I designed?
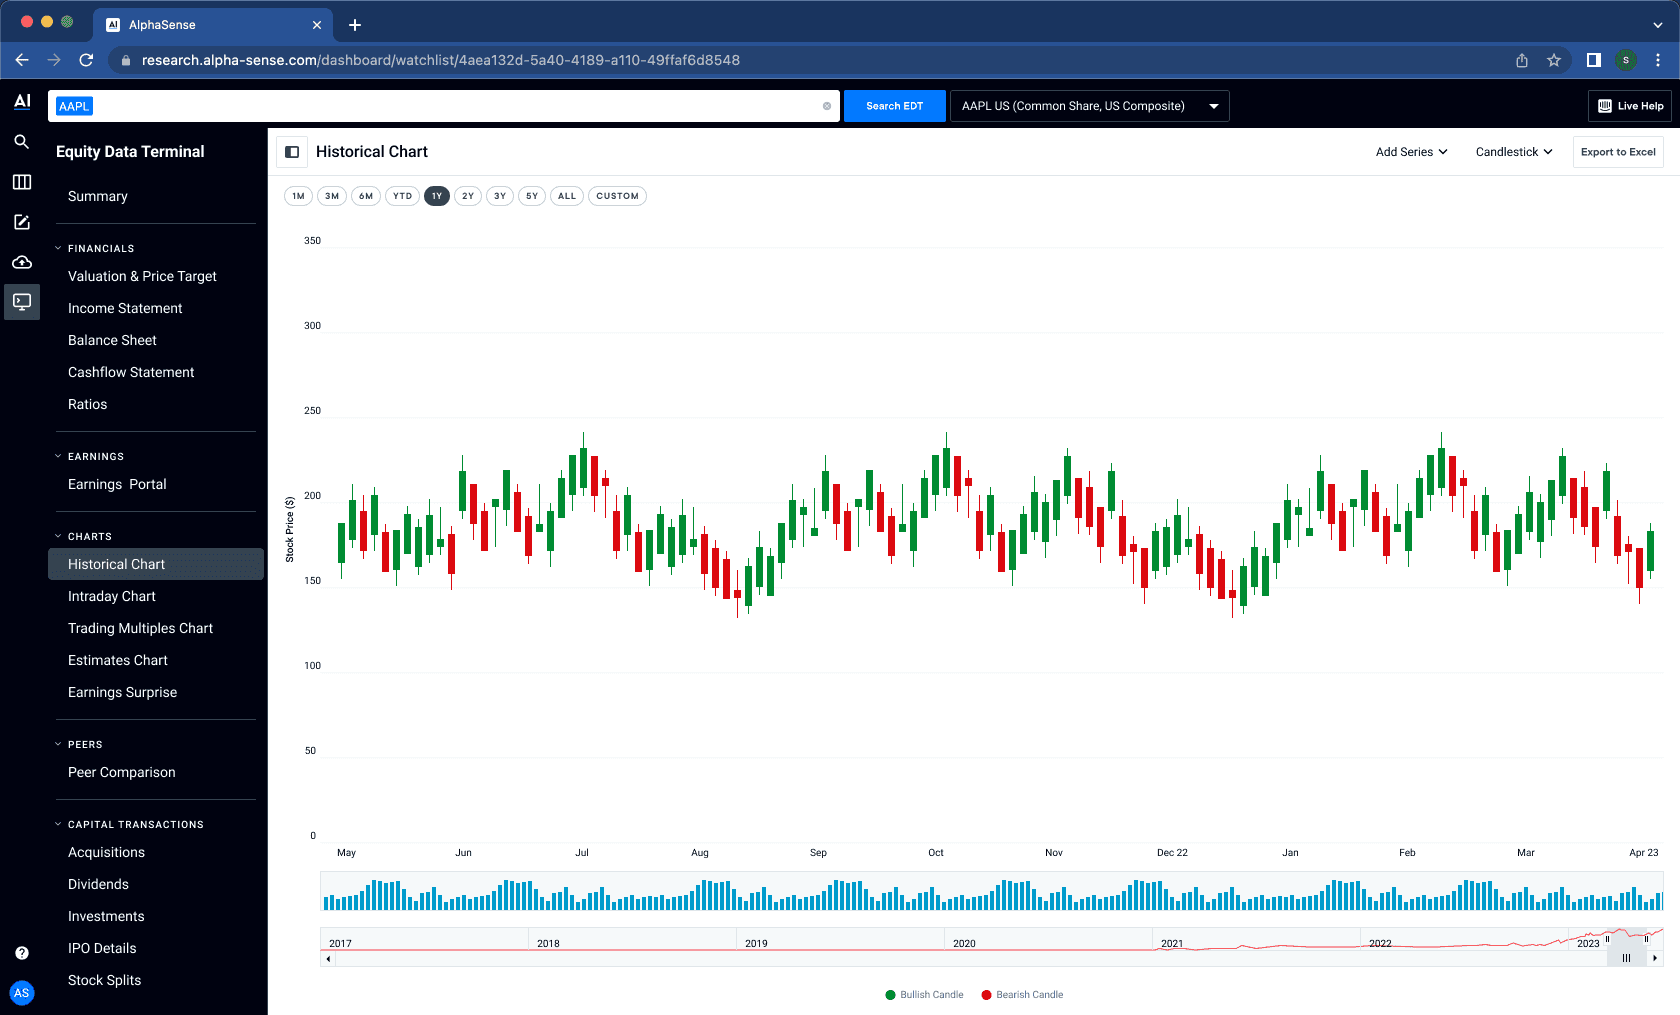
Unified Dashboard: Aggregates company profiles, financials, and news.
Advanced Search: Enables filtering by sector, market cap, and other parameters.
Customizable Widgets: Users can tailor their dashboard with preferred data modules.
Real-time Alerts: Notifications for significant market movements or company updates
Collaboration & Execution
My Role & Contribution
Conducted user interviews to gather insights into analyst workflows.
Developed wireframes and interactive prototypes for testing.
Collaborated with cross-functional teams to ensure feasibility and alignment with business goals.
Iterated designs based on user feedback and usability testing results.
Impact
Reduced time spent by analysts on data gathering by 40%.
Increased user engagement metrics by 25% within the first quarter post-launch.
Positive feedback from users highlighting improved efficiency and ease of use.
MVP Features
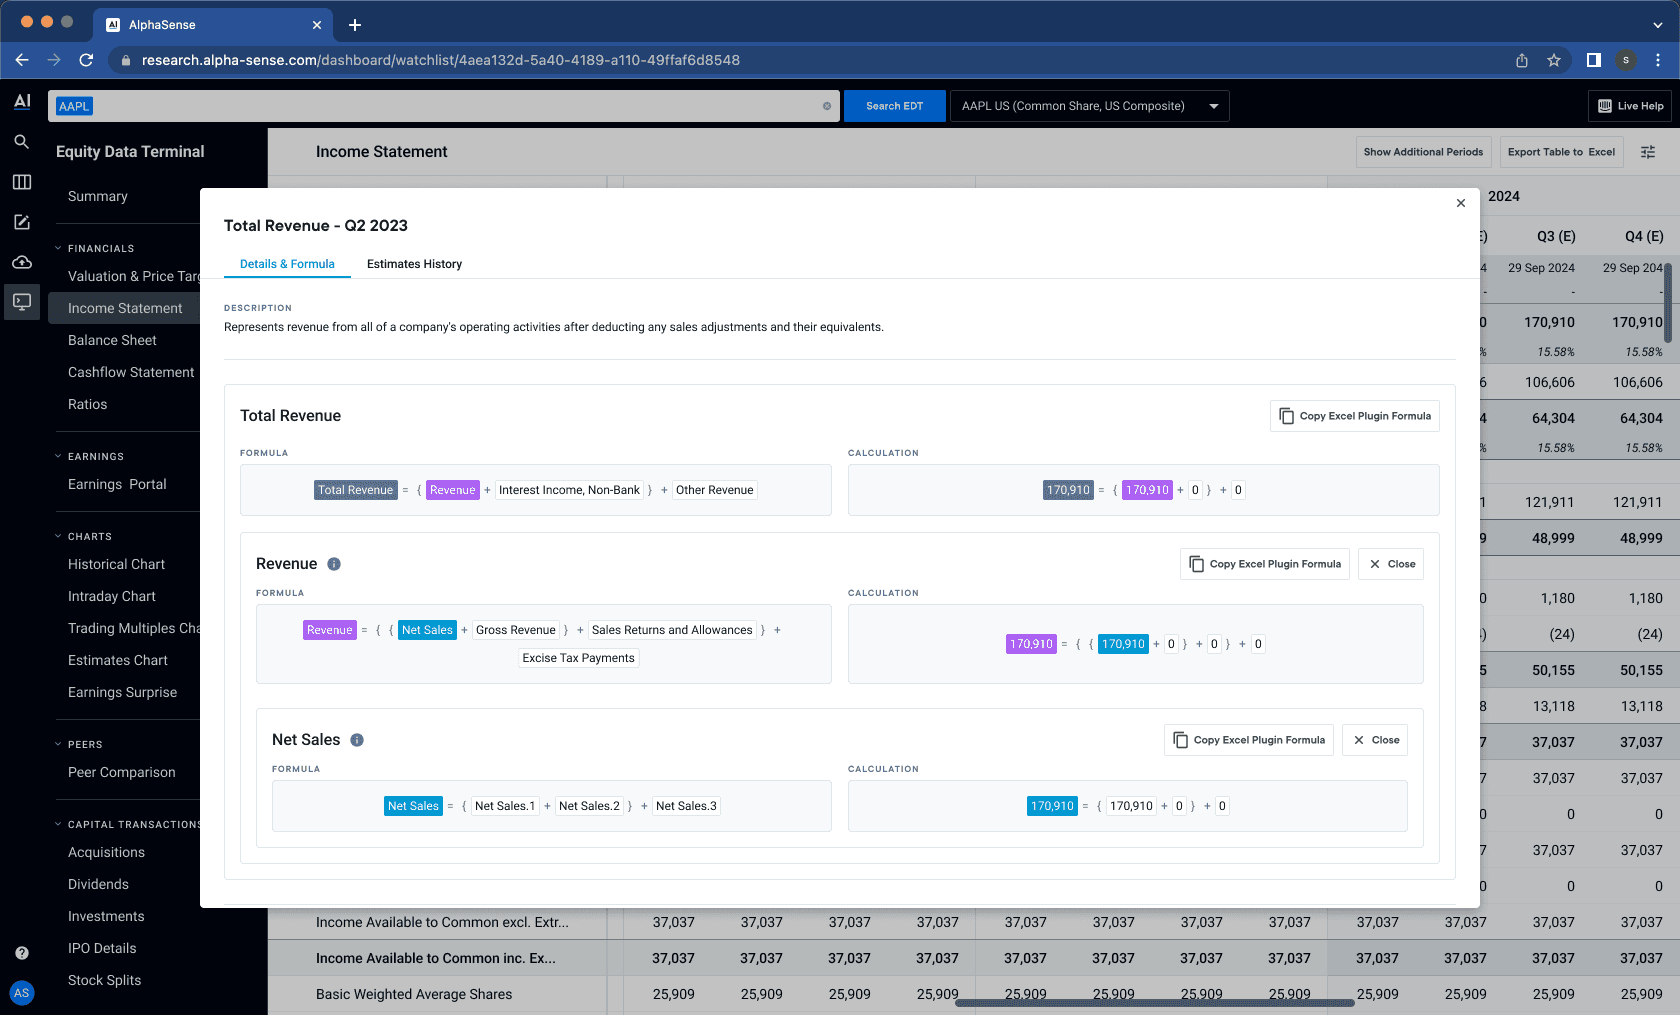
Company overview pages with key financial metrics.
Integration of third-party equity research reports.
Basic customization options for the dashboard.


Final Thoughts
This project underscored the importance of user-centric design in complex data environments. By focusing on the specific needs of financial analysts, we were able to create a tool that not only streamlined their workflow but also enhanced their decision-making capabilities.
Interested in working together?
Let's discuss how we can collaborate in bringing your next product vision to life.